Reporting - At a Deeper Level
The budget tab gives a quick look at the budget progress, but to go deeper on reporting, checkout the Reporting tab
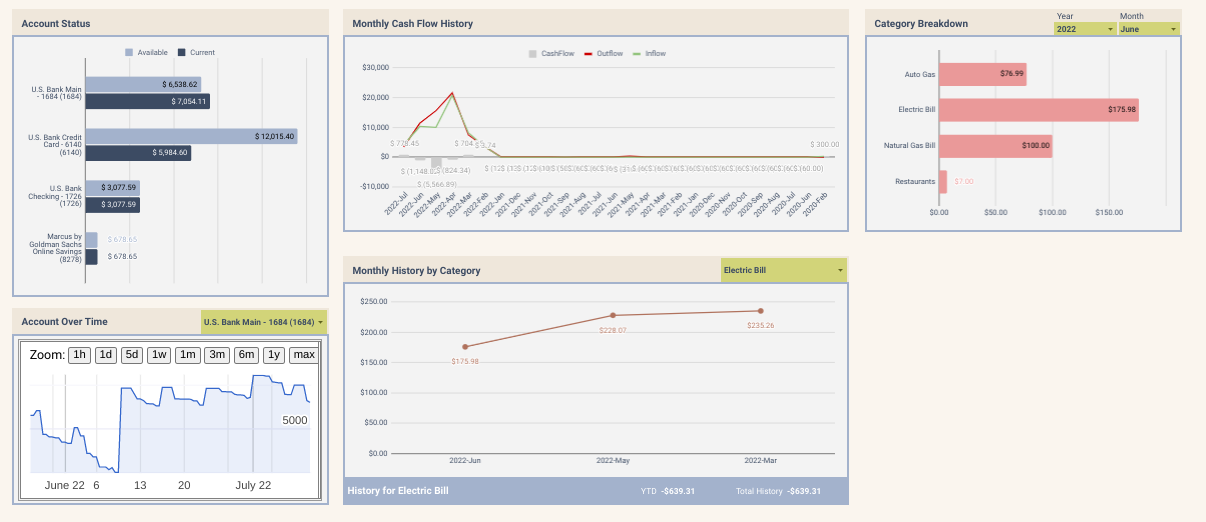
Check how your trending on your expense categories, your monthly cashflow, monthly expense breakdown, account balance over time, and more.
This tool is constantly evolving, so it will probably be a bit different (better!) than what you're seeing here.
Remember, it's a spreadsheet, so modify it to your desires if it doesn't quite meet your needs!
How does BTS access the transactions?
BTS utilizes Plaid to securely connect to your financial institution. Plaid is a leader in bank connectivity, and provides the security and privacy required. You've probably already used Plaid at some point; many financial apps utilize it for connection
Will my bank be on the list?
Plaid connects to 10 thousand plus Institutions. If you use any major bank or institution, it will be available. Most local banks are available as well.